2022 JA Teens & Personal Finance Survey - #FinancialLiteracyMonth
Executive Summary
Author: Junior Achievement of North Florida
Financial Literacy
Published:
Tuesday, 05 Apr 2022
Sharing

Image caption: 2022 JA Teens & Personal Finance Survey
Introduction
Junior Achievement USA and Citizens collaborated on a survey to better understand teens' perspectives on rising education costs, as well as their access to proper technology, and how these factors might impact plans for continuing education after high school. The survey also explored teens' use of Financial Technology (FinTech) compared to similar research from 2019. Wakefield Research conducted the survey of 1,000 teens between the ages of 13 and 18 between February 18 and 24, 2022. The JA Teens & Personal Finance Survey Executive Summary contains an overview of those findings.

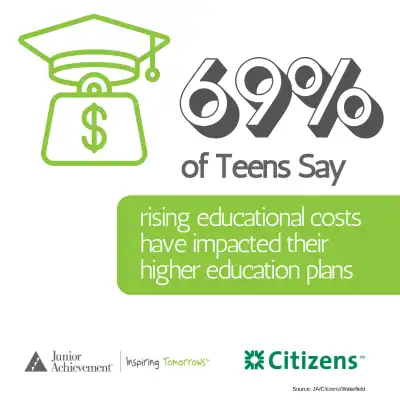
Image caption: 69% of teens say rising educational costs have impacted their higher education plans
Impact of Higher Costs on Teens' Plans for Higher Ed
The findings of the fifth annual JA Teens & Personal Finance Survey indicate wide-ranging concern among teens regarding financial anxiety and the future, prompting more than half (54%) of teens to say they feel unprepared to finance their futures. More than two-thirds of teens (69%) say that rising education costs have affected their plans for additional education after high school. The research shows that while nearly a third of teens (31%) say rising education costs have had no effect on their plans for after high school, almost as many (28%) say they are now only considering in-state schools, while around a fifth (22%) plan to live at home and commute to college, and one-in-ten (10%) are considering getting a two-year degree versus a four-year degree. Half of the respondents (50%) plan to enroll in a four-year college after high school.
The findings highlight the need for additional resources to assist teens in making financial decisions that impact them over the long term. Illustrated by the fact that a significant portion of teens (41%) say they have had no financial literacy classes in school.
Cost weighs heavily on the minds of teens when it comes to pursuing education after high school, with nearly half of respondents (49%) citing it as one of their biggest concerns. This was followed by having to take out student loans (43%), being unsure of what to do for a career (32%), being unsure if higher education is worth the investment (27%), and moving away from home or having to be around new people (both at 25%). However, a high proportion of teens said some of these concerns could be addressed with a better understanding of how student loans work (39%). Others expressed that knowing how education ties to jobs (38%) or having access to lower-cost alternatives (32%) would help ease their concerns.

Image caption: 66% of teens are concerned about having the technology needed to complete a degree
The Digital Divide Continues in Post-Secondary Education
Of those teens planning to pursue a four-year degree, two-thirds (66%) also expressed concern about having the technology needed to complete a degree. Factors that contribute to this concern include the cost of devices (52%), poor Wi-Fi access/connectivity (28%), or simply not being "tech-savvy" (23%). Additionally, significant percentages of teens expressed concern about having a lack of sufficient software or programs (21%), working with outdated equipment (17%), or the lack of a computer at home (16%).

Image caption: 62% of teens use mobile apps for money management, compared to 48% in 2019
FinTech and Teens' Changing Behaviors
Despite concerns expressed about learning technology, teens have made a significant shift toward using financial technology (FinTech) in recent years when managing their money, but not necessarily for making purchases. Today, 62 percent of teens say they use mobile or online applications to assist with money management, compared to 48 percent in 2019 (+ 14%). Despite this shift, the current survey shows teens' preferred payment method is still cash, noted by 38 percent of respondents, compared to FinTech apps (e.g., Zelle, Venmo, Apple Pay, etc.), as selected by just 2 percent of respondents.
In 2019, 71 percent of teens said their parents were likely to use cash when giving them money. That's down to 57 percent today (-14%). The use of FinTech applications for this purpose rose from 9 percent to 20 percent over that same period (+11%). This trend also appears to be impacting other traditional financial tools, with declining use of debit cards (59% today vs. 62% in 2019), credit cards (24% today vs. 30% in 2019), and checkbooks (9% today vs. 18% in 2019), over the same period.
Methodology
The Junior Achievement Fintech Survey was conducted by Wakefield Research (www.wakefieldresearch.com) among 1,000 nationally representative US Teens ages 13-18, between February 18th and February 24th, 2022, using an email invitation and an online survey. Data was weighted to ensure a reliable and accurate representation of U.S. teens ages 13-18.
Results of any sample are subject to sampling variation. The magnitude of the variation is measurable and is affected by the number of interviews and the level of the percentages expressing the results. For the interviews conducted in this particular study, the chances are 95 in 100 that a survey result does not vary, plus or minus, by more than 3.1 percentage points from the result that would be obtained if interviews had been conducted with all persons in the universe represented by the sample.
We use cookies to provide you a personalized experience. How we do this is by analyzing user behavior on our site and sharing data with our advertising and analytics partners. You consent to our cookie policy if you continue to use this website.


